Create simple animated bar chart in React
Did you know you don’t need much to build an animated bar chart?
In this article, I will try to explain how to get such an effect with React. 📊
Before we start, I would highly recommend you to check out runnable example for the solution on our website:
Create simple animated bar chart in React
Final effect of the post:

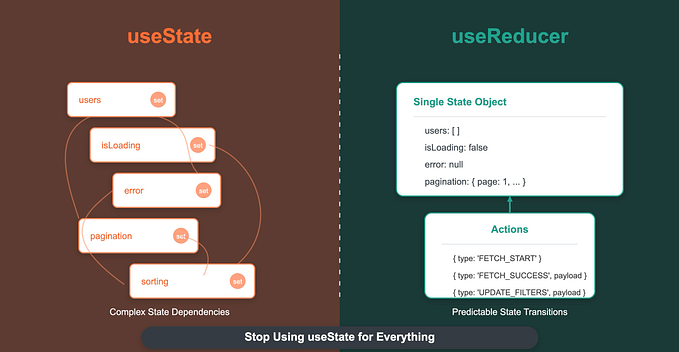
The main idea is to create individual bars that are described from 0 to 100%. The bars are arranged sequentially next to each other in a chart, using an example data set
based on the cosine function.
Each change of the dataset describing the chart causes a smooth re-rendering (this happens due to a simple style called transition).
The whole effect is achieved with a few lines, most of the effect is actually styles. 🎨
Practical example:
You can run this example here
What do you think about such a chart? Do you think it would be possible to construct a simple library for different types of charts?
Let me know in the comments! 😊
Write to us! ✉
If you have any problem to solve or questions that no one can answer related to a React or JavaScript topic, or you’re looking for a mentoring write to us on dirask.com -> Questions